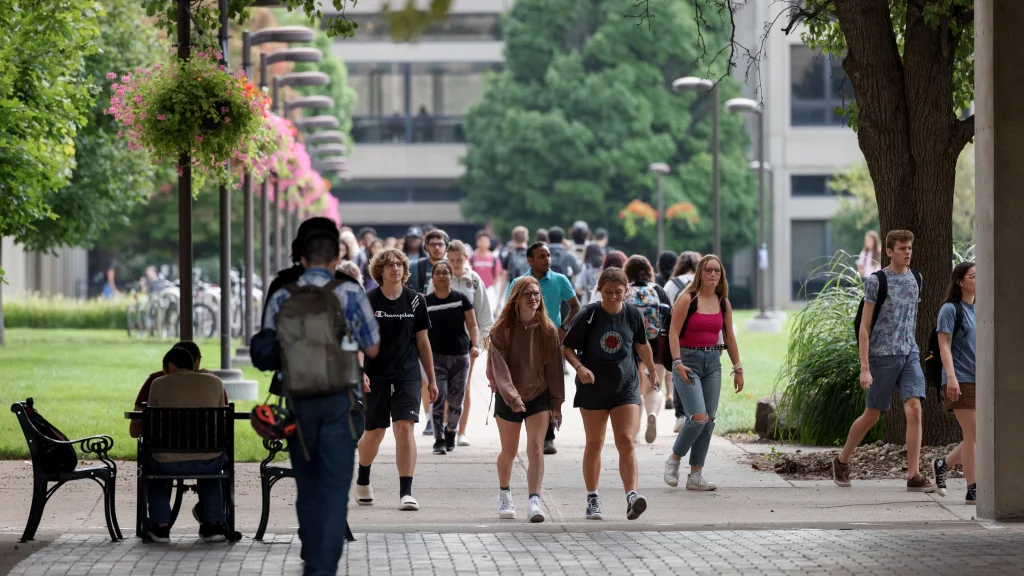
See yourself in Indy

Freshmen from US high schools
Students come from 92 Indiana counties and 29 states.
Facts on scores
You’re more than your scores. That’s why IU Indianapolis is test-optional. We let you choose whether or not to include the SAT or ACT in your application. Don’t worry—admission consideration is the same either way.
GPA facts
- GPA average: 3.53
- Middle 50% GPA range: 3.22 - 3.92
- Percentage with GPA of 4.0+: 20.2%
SAT scores
- Average: 1162
- Middle 50% range: 1050 - 1260
ACT scores
- Average: 27
- Middle 50% range: 23 - 31

Freshmen from international secondary schools
GPA facts
- GPA average: 3.51
- Middle 50% GPA range: 3.22 - 3.88
- Percentage with a GPA of 4.0+: 13.6%
(IU Indianapolis) allowed me to grow at my own pace.
Jada White B.S. Biology, Class of 2025

Transfer class from US colleges and universities
IU Indianapolis transfer students come from 46 Indiana counties and 27 states.
GPA facts
- GPA average: 3.19
- Middle 50% GPA range: 2.76 - 3.67
- Average number of credits transferred: 51

Graduate and professional school class
Our graduate and professional school students are from 49 states and more than 135 countries.
About the class
Master’s degree enrollment: 47.9%
Professional doctorate degree enrollment: 40.5%
Doctoral research degree enrollment: 9.8%
Female: 63.7%
Male: 36.3%
African American: 8.0%
Asian American: 8.7%
Hispanic/Latino: 7.9%
Two or more races: 4.4%
White: 60.5%
International students: 9.6%
Indiana residents: 72.6%
Out-of-state residents: 27.4%
IU Indianapolis
Office of Admissions
Campus Center, Room 255
420 University Blvd
Indianapolis,
IN
46202
USA
Monday: 9 a.m. - 5 p.m.
Tuesday: 9 a.m. - 5 p.m.
Wednesday: 9 a.m. - 5 p.m.
Thursday: 9 a.m. - 5 p.m.
Friday: 9 a.m. - 5 p.m.
Saturday: Closed
Sunday: Closed
Wednesday, November 26, virtual only 9 a.m.–12 p.m., and closed 12 p.m.–5 p.m.
Thursday, November 27, closed
Friday, November 28, closed
Monday, December 22, virtual only 9 a.m.–12 p.m., and closed 12 p.m.–5 p.m.
Tuesday, December 23, virtual only 9 a.m.–12 p.m., and closed 12 p.m.–5 p.m.
Wednesday, December 24, virtual only 9 a.m.–12 p.m. , and closed 12 p.m.–5 p.m.
Thursday, December 25, closed
January 1, closed
Friday, January 2, virtual only 9 a.m.–12 p.m., and closed 12 p.m.–5 p.m.